An autonomous machine can cover a large area, but headline capacity does not show how much useful work a team completes in a real shift. Routes include turns, obstacles, debris collection, charging, inspections, and manual touch-ups. Measuring productivity means comparing accepted cleaning results with the time and resources required.
A sound assessment uses a consistent baseline and measures labor alongside accepted output.
Establish a Fair Baseline
Choose a representative route and record its area, pavement type, typical debris, traffic pattern, and required cleaning standard. Note time spent preparing equipment, travelling between zones, sweeping, emptying collection bins, and finishing missed areas. Include combined staff hours when several people work on the route.
Use comparable shifts, since weather, seasonal debris, deliveries, and pedestrian traffic change the workload. The comparison is more useful when the autonomous street sweeper and the existing method work under similar conditions.
Measure Output Per Labor-Hour
Area covered per machine-hour helps explain route capacity, but it does not show the staff input required. Pair it with accepted area per labor-hour. Count area that meets the agreed cleaning standard, then divide it by total staff time spent setting up, supervising, clearing debris, checking results, and maintaining equipment.
Productivity gain (%) = ((new accepted area per labor-hour − baseline area per labor-hour) ÷ baseline area per labor-hour) × 100.
For example, suppose a manual team cleans 4,000 m² using five combined labor-hours. That equals 800 m² per labor-hour. If a robot-assisted workflow cleans 5,000 m² using four combined labor-hours, it reaches 1,250 m² per labor-hour. The illustrative productivity gain is 56.25%. This example is illustrative, not a claim for a specific machine.
Separate Rated Capacity From Field Results
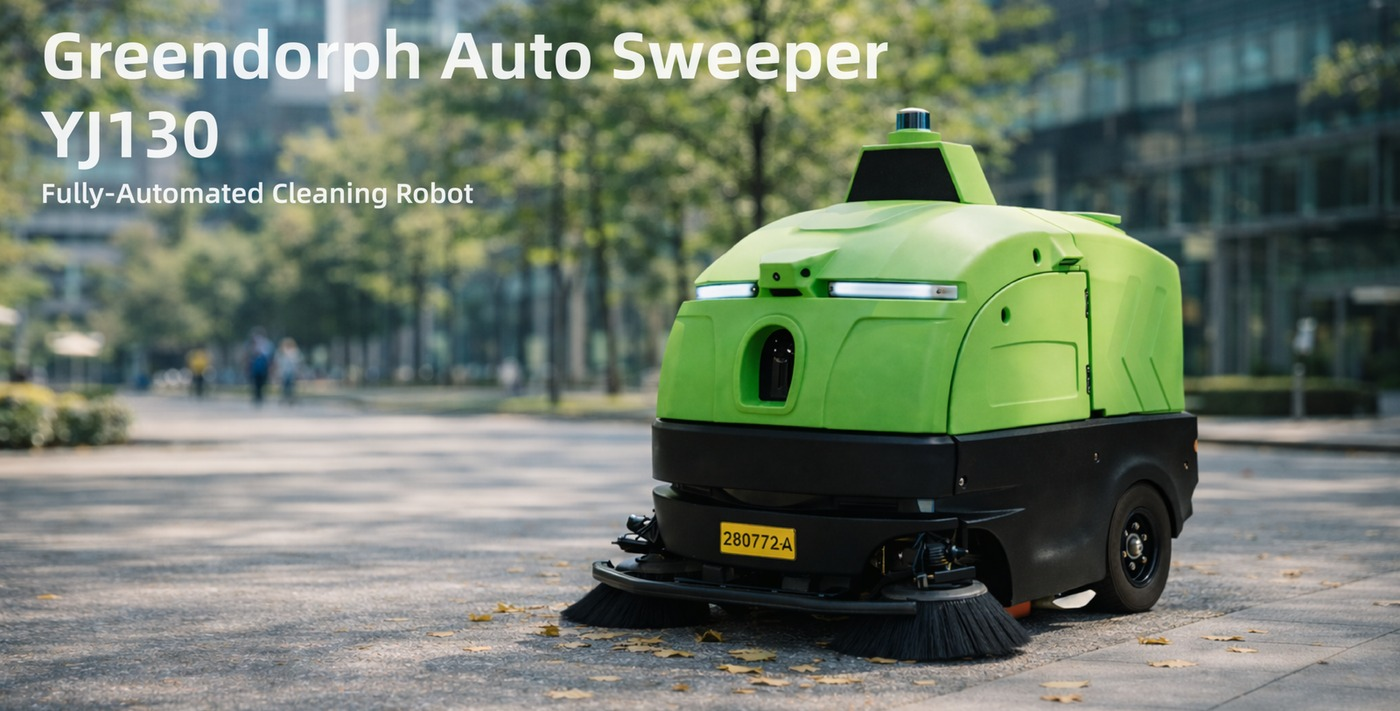
Manufacturers publish rated cleaning efficiency to describe designed coverage under specified conditions. Greendorph lists the YJ130 with a 130 cm cleaning width, rated cleaning efficiency of 5,760 m² per hour, and average operating time of 6–8 hours. These figures help screen equipment but do not forecast daily output directly.
Turns, narrow passages, obstacles, mixed debris, charging, and bin emptying reduce effective coverage. Record full route time alongside moving time to identify where capacity is lost. A street sweeper that finishes a smaller route consistently and meets the required standard can deliver more value than one with a higher rated figure but frequent interruptions.
Track Quality and Intervention
Fast coverage matters only if the surface is acceptably clean. Use a consistent inspection method to record missed edges, residual litter, dust, and areas requiring repeat passes. Apply the same criteria to manual and automated cleaning. Photographs support records, while a checklist makes results easier to compare.
Log how often the autonomous street sweeper stops for an obstacle, needs assistance, or leaves a section unfinished. Record charging interruptions, equipment faults, and manual touch-ups. These measures show whether the machine operates independently in the chosen setting and where mapping, scheduling, or training needs adjustment.
Record productive runtime separately from scheduled availability. A machine scheduled for six hours but paused for charging, blocked routes, or bin service does not deliver six hours of active cleaning.
Calculate uptime as available working time divided by scheduled operating time, then compare results across routes and shifts. This separation helps explain whether lost output comes from route design, service interruptions, or equipment performance.
Calculate Cost Per Cleaned Square Meter
Productivity does not automatically translate into savings. Compare total operating cost with accepted area cleaned. Include staff time, electricity, consumables, maintenance, repairs, training, downtime, and purchase cost allocated over the machine’s useful life. Where relevant, include costs for separate equipment the new workflow replaces.
Cost per accepted m² = total cleaning cost ÷ accepted area cleaned.
Use the same accounting period and scope for both methods. A lower cost per square meter alongside equal or better inspection results is stronger evidence of value than labor savings alone. Keep assumptions visible, especially when estimating service life or staff time freed for other tasks.
Run a Controlled Site Trial
Pilot the machine on a representative route. Set a baseline, define a cleaning-quality threshold, and record the same metrics during each trial shift. Include setup and recovery time so the comparison reflects the whole task, not just machine movement. Repeat runs help distinguish consistent results from one-off success.
Discuss results with operators and supervisors. They can explain delays, repeated obstacles, or debris that needs a different method. Adjust the route and schedule, then measure again before extending deployment to other areas.
Turn Measurements Into a Deployment Decision
The right street sweeper should fit the surface, debris profile, route geometry, staffing model, and service plan. Greendorph’s street sweeper includes autonomous and assisted outdoor cleaning models. Product specifications help shortlist options, while a controlled trial shows how each performs in daily operation.
For product and company information, visit Greendorph. Base the decision on accepted area per labor-hour, intervention frequency, cleaning quality, uptime, and cost per square meter. Together, these indicators provide a defensible way to assess whether automation improves productivity at a particular site.
